Create an Interactive Crime Map Using Shiny
Before we start
This is the very first post of my blog, Doctrine of the Mean. You can play around this demo in Shiny server. Also if you’re interested, the code is in my Github repo.
This post will give a brief introduction in using Shiny to create an interactive crime map and deploy it on ShinyApps.io. For details on how Shiny works, please check Shiny’s Documentation
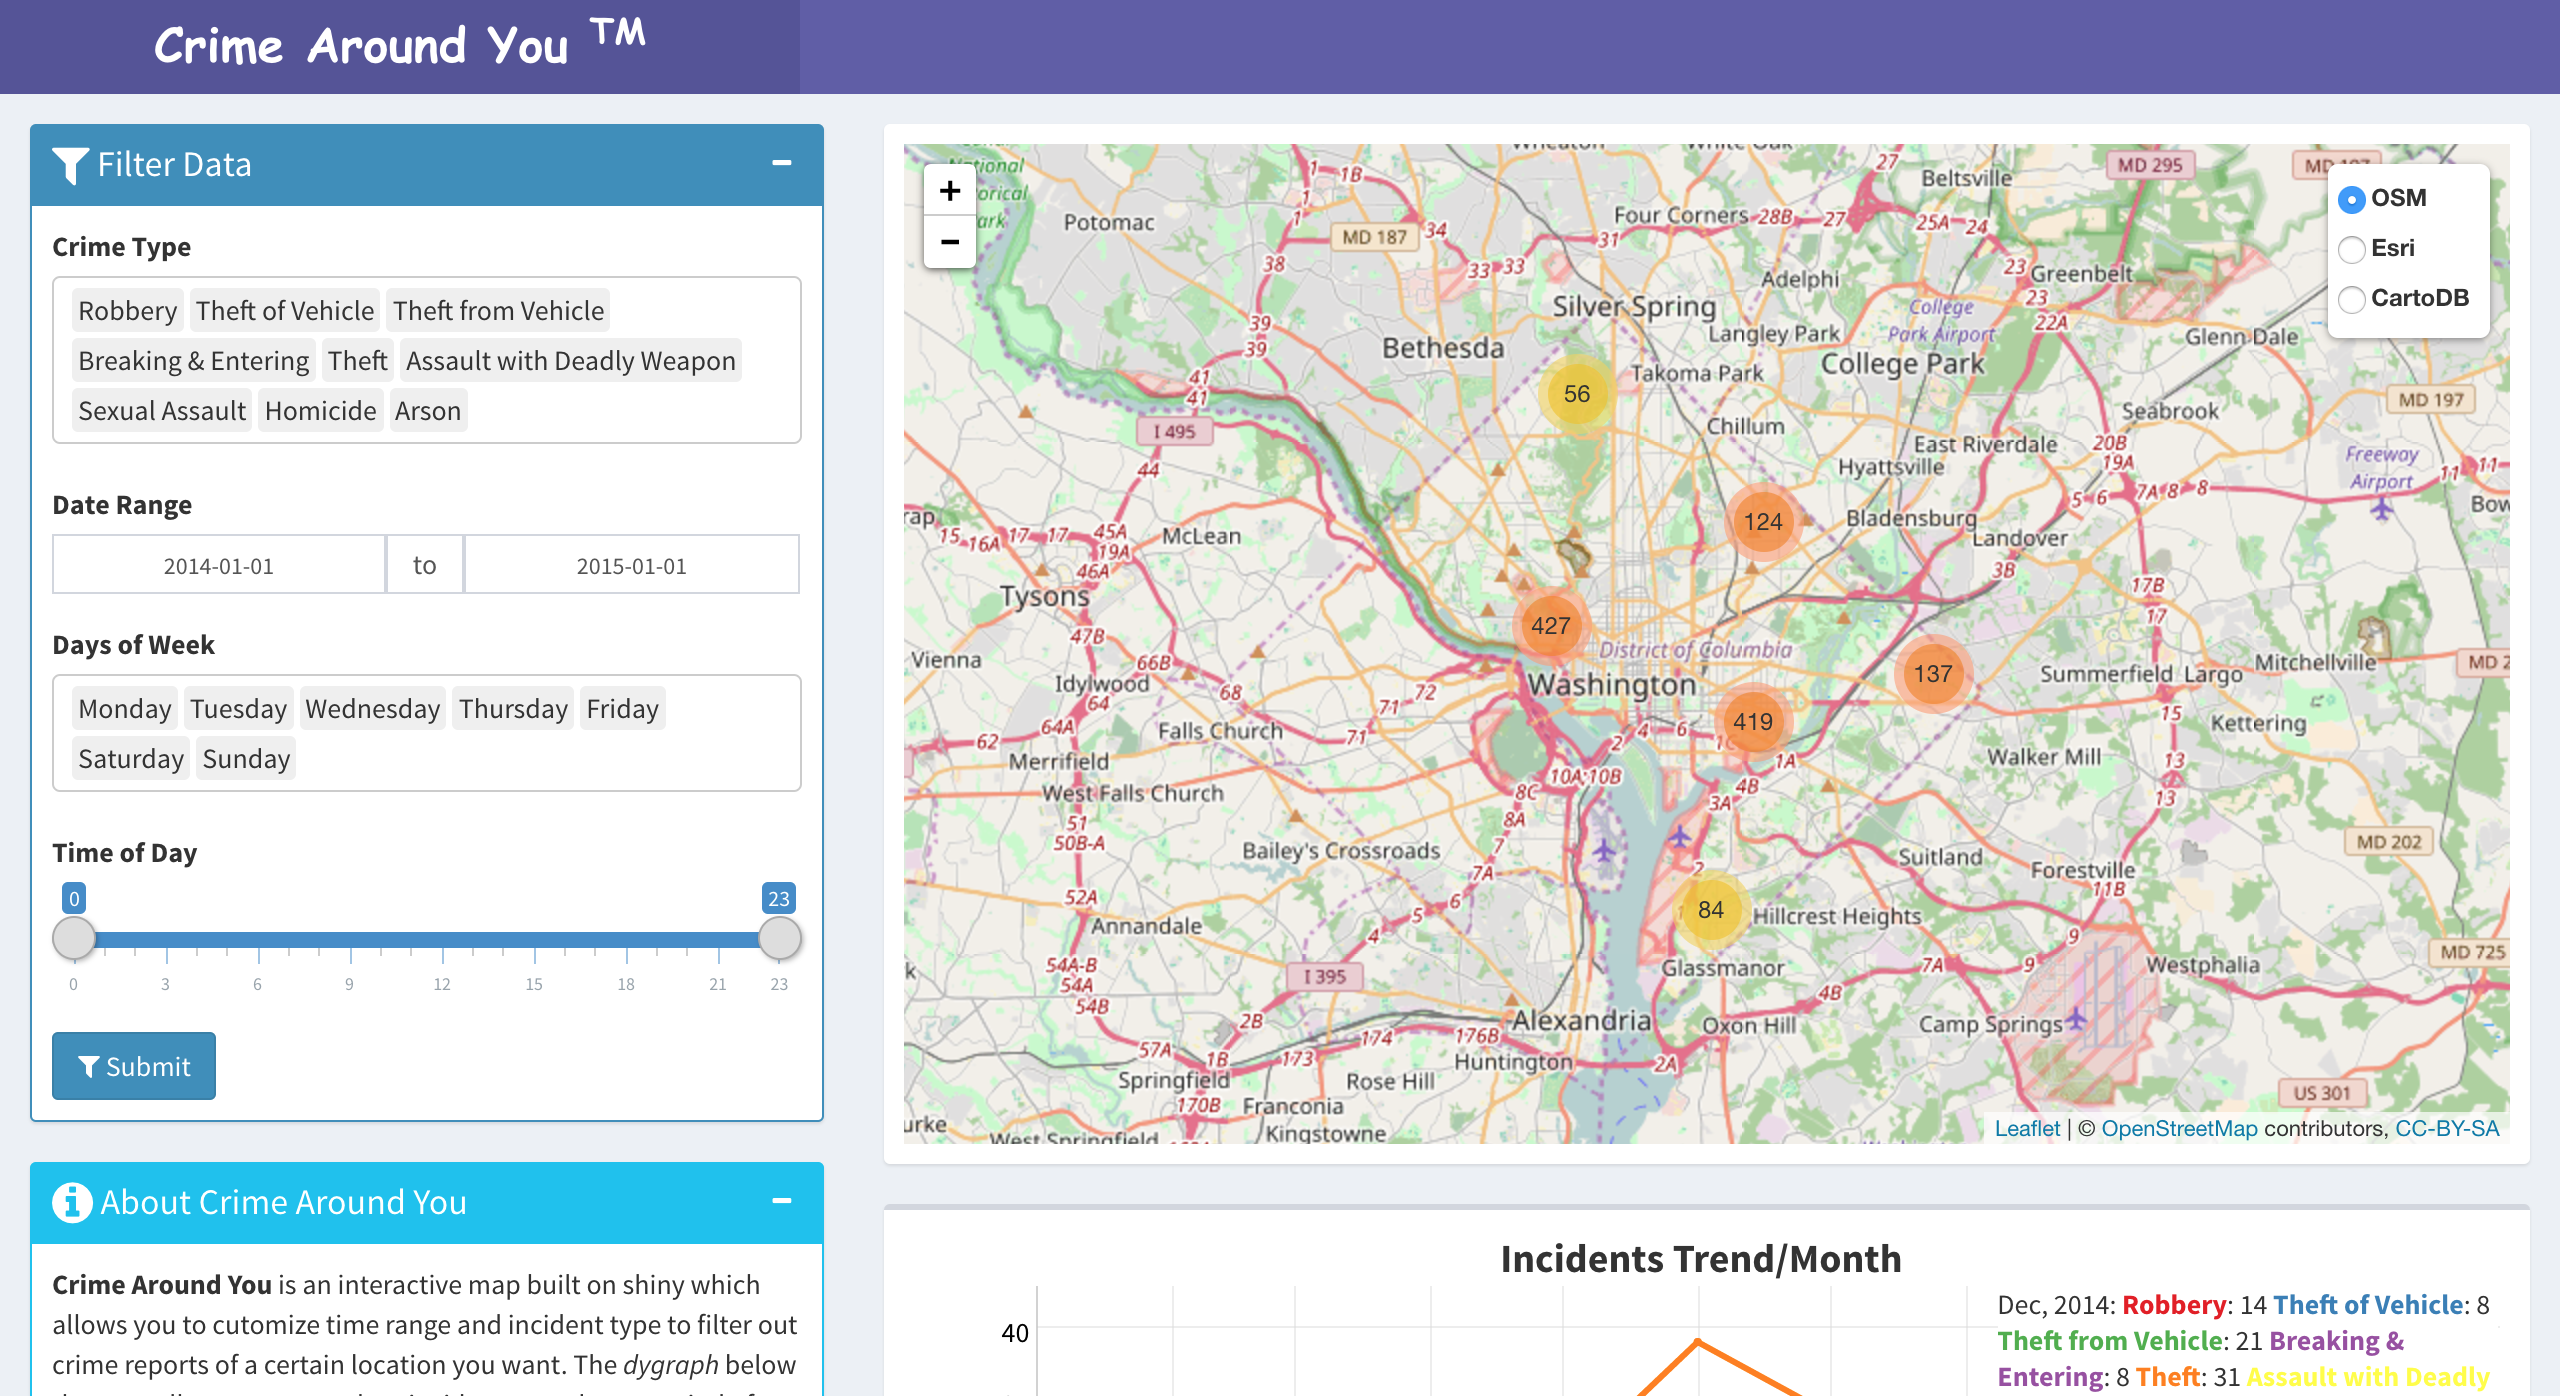
At the end of the day, you can build your own crime map like I did above!
Set up
R packages will be used in making of the map:
library(Shiny)
library(Shinydashboard)
library(leaflet)
library(dplyr) #optional, data processing
library(data.table) #optional, for fast read data
Not so much, huh? Only 3 must-use packages. The rest are totally opitonal, you can absolutely add more widgets to enhance your map.
Fantastic Data and Where to Find Them
Data is not like Pokemon you can easily catch(at least not something like Pidgey). Originally, the data we used in this map is from DC Metropolitan Police Department, hosted by Socrata. For some reason after July, the data link provided in the Shiny App is no longer publicly accessible. Luckily, I saved the data between early 2013 to March 2016. Feel free to download it if you want follow along.
If you want to reproduce your own crime map, you can find a lot public crime report data from Socrata online database.
Shiny Architecture
Since I’m not very good at summarizing concepts, I will just quote from Shiny’s official homepage.
Shiny is a web applicaton framework for R
Turn your analysis into interactive web applications. No HTML, CSS, or JavaScript knowledge required
Yes, Shiny is as simple as it sounds!
Basically, if you’re a completely HTML/CSS newbie and also luckily know some R like me, then bang! Shiny is the savior for you.
With Shiny, you can easily build a web app just like building a lego.
In order to avoid lego epic fail like above, we need to have a brief understanding of the logic shiny organize everything together.
To build an app using Shiny, every app needs at least two components:
* a user-interface script, ui.R
* a server script, server.R
The ui.R script controls the layout and appearance of your app. It receives user input data and transfer them to server.R for back-end functions and graphs use.
The server.R script contains all instructions and models for back-end computations and data processing. It uses input data from ui.R to feed functions and output results to front-end to interact with users.
Work, Work
Data Pre-processing
The data Socrata provides is already well organized. We only need to make a few tweaks to make it easier for our afterwards processing.
# Read data. fread() is a super quick way to read large dataset. tbl_df() will transfer table to tibble for easier data processing
data <- tbl_df(fread('Washington_DC.csv',header = T))

# Firstly, take a look how the data looks like.
> head(data)
# A tibble: 6 × 20
  incident_id case_number      incident_datetime incident_type_primary
        <int>       <int>                  <chr>                 <chr>
1   178961853    13004425 01/11/2013 03:00:00 AM               ROBBERY
2   178961854    13002300 01/06/2013 05:00:00 PM   MOTOR VEHICLE THEFT
3   178961855    13001910 01/05/2013 01:25:00 PM   MOTOR VEHICLE THEFT
4   178961856    13002432 01/06/2013 09:16:00 PM          THEFT F/AUTO
5   178961857    13001226 01/04/2013 04:25:00 AM              BURGLARY
6   178961858    13002301 01/06/2013 03:52:00 PM   MOTOR VEHICLE THEFT
# ... with 16 more variables: incident_description <chr>, clearance_type <lgl>,
#   address_1 <chr>, address_2 <lgl>, city <chr>, state <chr>, zip <chr>,
#   country <chr>, latitude <dbl>, longitude <dbl>, created_at <chr>,
#   updated_at <chr>, location <chr>, hour_of_day <int>, day_of_week <chr>,
#   parent_incident_type <chr>

# Modify some columns' data types. Create a new column 'content', to summarize crime incident report.
data <- data %>%
  mutate(incident_date = as.Date(data$incident_datetime, format = "%m/%d/%Y")) %>%
  mutate(incidentType = as.factor(parent_incident_type)) %>%
  mutate(content = paste('<b>',incidentType,'</b>')) %>%
  mutate(content = paste(sep = '<br/>', content,incident_datetime,address_1)) %>%
  mutate(year_month = zoo::as.yearmon(incident_date))
UI
Shiny’s aesthetics is simple, everything is arranged in blocks. It’s your choice on how to divide and rearrange them.
Shinydashboard provides an easy R interface to build a Bootstrap style website. In other words, besides calling Shinydashboard function like regular R packages, if you happen to know some knowledge of HTML/CSS, there is no limit to your own customizable web design.
A dashboardPage consists of three components, a header, a sidebar, a body.
ui <- dashboardPage(header,
                    sidebar = dashboardSidebar(disable = T),
                    body)
header is as intuitive as it sounds. It’s the function we used to define our page title.
header <- dashboardHeader(title = p("Crime Around You"), titleWidth = 400)To make it easier, we disable sidebar, and put all contents into the body. Shiny adapts Bootstrap grid system. The overall width of a region is 12. Therefore, I set left 4 for dashboard and right 8 for the map.
body <- dashboardBody(
  fluidRow(
    dashboard, map
    )
  )
For our customizable dashboard, we want to use it to select crime type, date range, day of week, time of day and a submit button to explicitly submit our input to server.R to process. We will use Shiny input widgets to achieve our goals. The first parameter of all widgets functions we used is its inputID, which will be referenced in server.R to access the user input data. Likewise, we’ll also reference outputID from server.R to create ui elements.
dashboard <- column(width =4,
                     # width set to NULL when use column-based layout
                     box(width = NULL , title =tagList(shiny::icon("filter",class = 'fa-lg'), "Filter Data") ,
                         solidHeader = T, collapsible = T, status = 'primary',
                         # create a select-input widget for crime type selection
                         selectizeInput('crimeType','Crime Type', choices = type, width = 380,
                                        selected = c('Robbery', 'Theft of Vehicle',"Theft from Vehicle",
                                                     "Breaking & Entering","Theft","Assault with Deadly Weapon",
                                                     "Sexual Assault","Homicide","Arson"),multiple = T),
                         # create a date-range-input widget
                         dateRangeInput('dates', label = "Date Range",width = 380,
                                        start = '2014-01-01', end = '2015-01-01',
                                        min = "2013-01-01", max = "2016-08-01"
                         ),
                         # create a select-input widget for day of week selection
                         selectizeInput('day_of_week','Days of Week', width = 380,
                                        choices = c('Monday','Tuesday','Wednesday','Thursday','Friday','Saturday','Sunday'),
                                        selected = c('Monday','Tuesday','Wednesday','Thursday','Friday','Saturday','Sunday'),
                                        multiple = T),
                         # create a slder-input widget for time of day selection
                         sliderInput('time_of_day','Time of Day', min = 0, max = 23,width = 380,
                                     value = c(0,23), step = 1),
                         # create a submit-button for user explicitly confirm data input
                         submitButton(text = "Submit",icon =icon('filter'))
                         )
                     )
map <- column(width =8,
                     box(width = NULL, solidHeader = TRUE,
                         leafletOutput('crimeMap',height = 500)))
Server
server.R will reference user input data by inputID defined in ui.R and also define outputID when create content render for ui.R use.
# Customize crime type icons
crimeIcons <- iconList(
    Robbery = makeIcon(iconUrl = './icon/Robbery.png',iconWidth = 35,iconHeight = 35),
    `Theft of Vehicle` = makeIcon(iconUrl = './icon/Theft of Vehicle.png', iconWidth = 35, iconHeight = 35),
    `Theft from Vehicle` = makeIcon(iconUrl = './icon/Theft from Vehicle.png', iconWidth = 35, iconHeight = 35),
    `Breaking & Entering` = makeIcon(iconUrl = './icon/Breaking & Entering.png', iconWidth = 35, iconHeight = 35),
    Theft = makeIcon(iconUrl = './icon/Theft.png', iconWidth = 35, iconHeight = 35),
    `Sexual Assault` = makeIcon(iconUrl = './icon/Sexual Assault.png', iconWidth = 35, iconHeight = 35),
    `Assault with Deadly Weapon` = makeIcon(iconUrl = './icon/Assault with Deadly Weapon.png', iconWidth = 35, iconHeight = 35),
    Homicide = makeIcon(iconUrl ='./icon/Homicide.png' ,iconWidth =35 ,iconHeight = 35),
    Arson = makeIcon(iconUrl ='./icon/Arson.png' ,iconWidth = 35 ,iconHeight = 35)
  )
server <- function(input, output) {
    # Create a reactive expression to filter data set per user requests
    filteredData <- reactive({
      data %>%
        filter(parent_incident_type %in% input$crimeType ) %>%
        filter(incident_date > input$dates[1] & incident_date < input$dates[2]) %>%
        filter(day_of_week %in% input$day_of_week) %>%
        filter(hour_of_day >= input$time_of_day & hour_of_day <= input$time_of_day)
    })
    # Use Leaflet to render crime map
    output$crimeMap <- renderLeaflet({
     leaflet(filteredData()) %>%
        addTiles(group = 'OSM') %>%
        addMarkers(
          ~longitude, ~latitude, popup = ~content,
          icon = ~crimeIcons[incidentType],clusterOptions = markerClusterOptions()
        )
    })
  }
Till now, we’ve finished scripting part. Now you can click on Run App to see how your baby looks like.

Hmm.., looks quite nice, isn’t it? Although it is a very simple version of a crime map, be proud of yourself if it’s your first Shiny app. There is always room to add more htmlwidgets to enrich your app step by step.
Deploy to ShinyApps.io
Once you finished testing and final checking your code, it’s time to showcase your baby to the world!
Since ShinyApps.io is also a RStudio product, we can have painless seamless one-click service to publish your apps online.
First you will need a ShinyApps.io account. Then at top right corner of your code pane, there is a blue drop down button let you manage your published applciations and accounts.
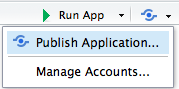
For first time user, click either Publish Application or Manage Acconts. RStudio will first install some necessary packages for deployment. Then you will get a prompt to ask you to connect your account. We will choose ShinyApps.io here.
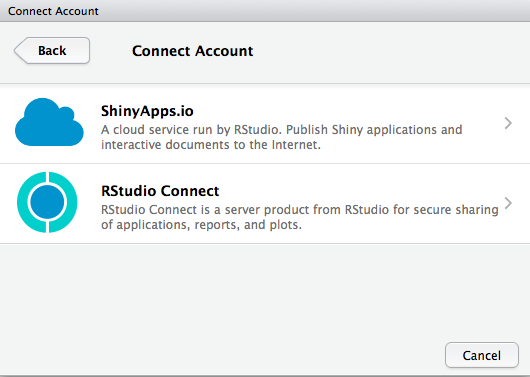
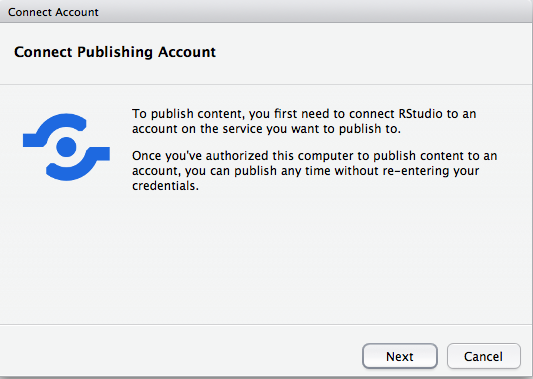
The next page is censored because you need to enter your ShinyApps.io API key here. Once you connect your account to RStudio, you’re ready to deploy it to your own ShinyApps.io account.

And, voila! That’s it! You have your own crime report map with a customizable dashboard.
Please comment below if you have any questions or suggestions about this tutorial or my code!
Leave a Comment